Harnessing Traffic Survey Data for Safer Roads
Introduction
Road safety is a growing concern for governments, urban planners, and communities worldwide. Every year, road accidents result in countless injuries and fatalities, highlighting the urgent need for effective solutions. One of the most powerful tools in this mission is traffic survey data—a critical resource that provides insights into traffic patterns and potential hazards. By leveraging this data, authorities can create safer roadways and minimize accidents.
Understanding Traffic Survey Data
Traffic survey data is a structured collection of information about vehicular and pedestrian movement within a specific area. It includes metrics like:
- Traffic volume during different times of the day.
- Speed data for vehicles in various zones.
- Pedestrian crossing patterns.
- Road conditions and their impact on traffic flow.
- Accident-prone areas (also known as black spots).
This data is gathered through methods like manual observation, radar systems, video analytics, and mobile GPS tracking. It provides a comprehensive understanding of how roads are used and where safety risks may lie.
The Connection Between Traffic Data and Road Safety
Traffic survey data is instrumental in identifying and addressing road safety challenges. Here’s how:
- Spotting High-Risk Areas
By analyzing accident reports and traffic patterns, traffic data can identify high-risk zones. These are areas where accidents frequently occur due to issues like poor visibility, confusing signage, or inadequate traffic control measures. - Improving Road Design
Data on traffic flow and vehicle behavior helps planners design safer roads and intersections. For instance, roundabouts can replace traditional intersections to reduce collision points, while adding dedicated lanes for cyclists can prevent accidents. - Enhancing Traffic Signals and Signage
Traffic data reveals whether existing signals and signs are effective. If a particular intersection sees frequent traffic jams or accidents, adjusting the timing of traffic lights or adding clearer signage can significantly improve safety. - Speed Management
Speeding is a leading cause of road accidents. Traffic survey data helps identify areas where vehicles frequently exceed speed limits, enabling authorities to implement speed bumps, cameras, or stricter enforcement in those zones. - Pedestrian Safety
Pedestrian data highlights locations where crossings are unsafe. Adding features like pedestrian bridges, zebra crossings, or flashing beacons at busy intersections can save lives.
Applications of Traffic Survey Data in Safety Projects
- Designing Safe School Zones
Schools are high-traffic areas during specific times of the day. Traffic data helps create safer school zones by identifying where to place speed limits, pedestrian crossings, and parking areas. - Implementing Vision Zero Strategies
Many cities are adopting the “Vision Zero” approach, which aims to eliminate traffic fatalities. Traffic survey data is at the heart of these initiatives, guiding interventions to address the most pressing safety issues. - Accident Reconstruction and Analysis
Post-accident traffic data helps authorities understand the root causes of accidents. This information is crucial for preventing similar incidents in the future. - Adaptive Traffic Management Systems
Smart traffic lights and dynamic signage use real-time data to adapt to changing road conditions, reducing the likelihood of accidents caused by congestion or sudden stops.
Success Stories in Traffic Data Application
- Sweden’s Vision Zero: Sweden has successfully reduced road fatalities by integrating traffic survey data into its Vision Zero program. By focusing on high-risk areas and vulnerable road users, the country has become a global leader in road safety.
- New York City’s Pedestrian Safety Action Plan: Traffic data helped NYC identify accident hotspots, leading to the installation of speed cameras and redesigned intersections. The result? A significant drop in pedestrian fatalities.
Challenges in Using Traffic Data for Safety
Despite its benefits, using traffic survey data for safety comes with challenges:
- Data Accuracy: Incomplete or outdated data can lead to ineffective safety measures.
- Resource Limitations: Collecting and analyzing data requires investment in technology and expertise.
- Privacy Concerns: Real-time traffic data, especially from mobile sources, must be managed responsibly to protect users’ privacy.
To overcome these hurdles, collaboration between governments, technology providers, and communities is essential.
The Role of Technology in Traffic Data Analysis
Advancements in technology are revolutionizing how traffic data is collected and used. Tools like artificial intelligence (AI) and machine learning (ML) can analyze vast amounts of data quickly, identifying patterns and predicting future risks. For example:
- AI-powered cameras can detect speeding, illegal parking, or pedestrian violations.
- Machine learning algorithms can predict accident hotspots based on historical data.
- IoT-enabled sensors provide real-time updates on road conditions, helping authorities take immediate action.
Conclusion
Road safety is not just about enforcing rules; it’s about understanding the factors that lead to accidents and addressing them proactively. Traffic survey data provides the insights needed to make roads safer for everyone—drivers, pedestrians, and cyclists alike.
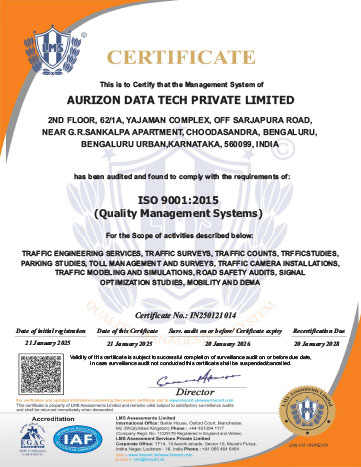
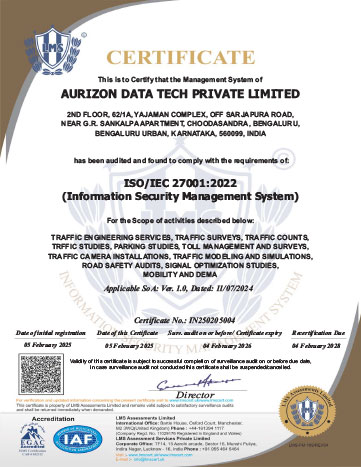
At Aurizon Data Tech, we specialize in delivering accurate, actionable traffic data to help create safer communities. Whether you’re a city planner, transport authority, or safety advocate, our solutions can support your mission to reduce accidents and save lives.


